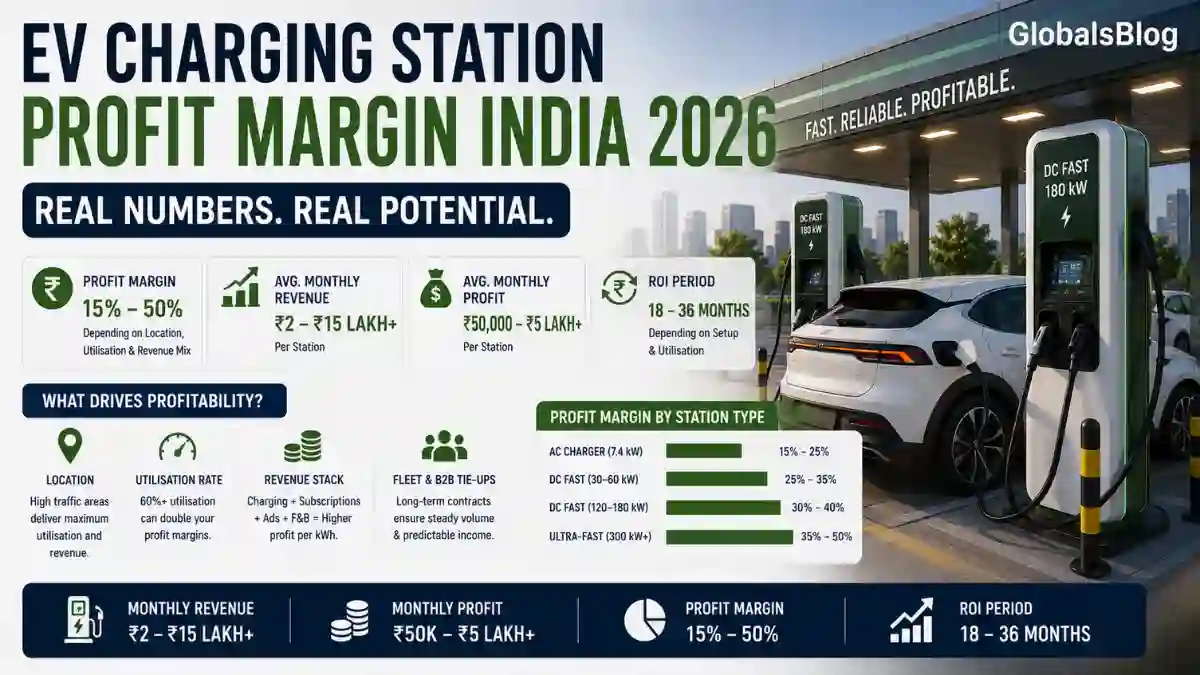
15% at a poorly placed station. 50% at a premium highway stop. Here's the exact formula — utilisation, revenue stacks, and the fleet subscription model that stabilises early income.
🔥 Trending in this cluster
- The EV Charging Station That Made ₹80,000/Month — And the One That Made ₹12,000. What Was Different?
- Utilisation Is Everything: How 15% Usage vs 40% Usage Changes Your Entire Business Case
- The Fleet Subscription Model: How Smart Operators Guarantee Revenue Before a Single Walk-In Customer
Most EV charging station profit discussions in India quote the same number: 15–30% margins. That range is technically accurate and almost completely useless for planning a real business. The actual margin at any given station depends on five variables — utilisation rate, charger type, electricity buy rate, location rent, and whether the operator has built ancillary revenue streams. The gap between 15% and 50% is not luck. It is these five variables managed well or poorly.
This guide breaks down the EV charging station profit margin with real scenario modelling: three types of stations, two utilisation scenarios each, and the specific levers that move margins from thin to strong. It also covers the fleet subscription model — the single most underused profit strategy among new operators in India — and the revenue streams beyond charging fees that separate genuinely profitable stations from marginal ones.
The Core Revenue Equation
The fundamental EV charging economics are straightforward: you buy electricity from DISCOM at the concessional EV tariff (₹5–6.50 per kWh in most states in 2026) and sell charging services at ₹12–18 per kWh at public stations. The spread between your cost and your price — typically ₹5–12 per kWh — is your gross margin per unit sold, before fixed costs.
The Three Profit Scenarios
Utilisation: The Master Variable That Decides Everything
The same station, the same investment, the same charger — different utilisation produces completely different businesses. Here's what each utilisation band means in practice.
Revenue Streams Beyond Charging Fees
The most profitable EV charging operators in India aren't maximising charging revenue — they're building multiple revenue layers on top of the base charging income. This is the single most overlooked profit lever in the sector.
Monthly Income Benchmarks by Station Type
| Station Type | Investment | Monthly Revenue (40% util) | Monthly Profit | Annual ROI |
|---|---|---|---|---|
| AC Setup (2 chargers) | ₹1.5 lakh | ₹12,000–18,000 | ₹3,000–6,000 | ROI: 3–4 yrs |
| AC Hub (6 chargers) | ₹4 lakh | ₹35,000–55,000 | ₹12,000–22,000 | ROI: 2–3 yrs |
| DC Fast (single 60 kW) | ₹12 lakh | ₹45,000–80,000 | ₹18,000–35,000 | ROI: 2–3 yrs |
| DC Hub (4 × 60 kW) | ₹30 lakh | ₹2,50,000–5,00,000 | ₹80,000–2,00,000 | ROI: 18–30 mo |
| Highway Ultra-Fast Hub | ₹75 lakh+ | ₹8,00,000–15,00,000 | ₹3,00,000–7,00,000 | ROI: 12–20 mo |
*Monthly figures at 40% utilisation. Highway ultra-fast projections at 55–65% utilisation typical for well-located expressway stations.
"In busy areas, profit margins for an EV charging station franchise can go up to 25–50%. It's not just about charging fees — you can make extra money from ads, tie-ups with nearby shops, and fleet deals too."— Statiq Industry Analysis, September 2025
✓ Profit Maximisation Strategies for 2026
- Secure one fleet subscription contract before you launch — even a 10-vehicle delivery fleet guarantees enough base utilisation to cover fixed costs while walk-in demand builds
- Implement dynamic pricing from day one — charge 20–25% higher during the 8–10 AM and 6–9 PM peaks when EV users have the highest willingness to pay and queues form naturally
- Add solar + net metering at the planning stage rather than as a retrofit — the integration cost is significantly lower, and the electricity cost reduction permanently improves margins
- For government subsidies that directly improve your margin profile, see our EV Charging Subsidy Guide — Karnataka, Gujarat, and Delhi offer capital subsidies that reduce your effective investment cost by 20–25%
- Utilisation tracking via your EVSE software dashboard is the single most important operational metric — review it weekly and act on low-performing time slots with targeted pricing or corporate outreach
❌ Profit Mistakes That New Operators Make
- Projecting at peak utilisation from month one: New stations typically see 15–25% utilisation in the first 6 months regardless of location quality. Model your first-year cash flow at 20–25%, not the 40–50% you expect at maturity
- Single revenue stream dependency: A station that earns only from charging fees is fragile. The fleet subscription + advertising + retail partnership model creates resilience that pure charging revenue doesn't
- Ignoring DISCOM demand charges: High-power DC stations attract peak demand charges that can add 15–25% to your effective electricity cost. These aren't in the per-kWh rate — check your commercial tariff schedule before finalising your pricing
- Underpricing to attract customers: EV users choose charging stations based on reliability, connector compatibility, and location — not primarily on price. Racing to the bottom on per-kWh rates destroys margin without proportionally increasing utilisation
The Profit Is in the Variables You Control.
The EV charging station profit margin in India is not fixed at 15–30%. It is determined by five specific variables — utilisation, location, electricity cost, ancillary revenue streams, and whether you have fleet contracts. Every one of these is manageable. The operators who achieve 40–50% margins are not in better markets. They are running the same business more deliberately.
Leave a comment
Share a quick thought about this story.
Thanks for sharing your view. It is ready for review.
Please try again in a moment.